Overview
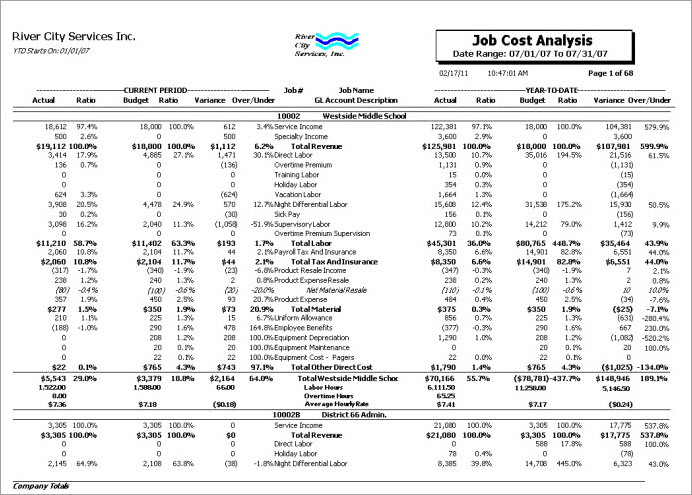
The Job Cost Analysis report lists the Current Period and Year To Date comparisons of actual and budget figures for selected Jobs. The format of the report is based on the format entered in the Formatting of Job Cost Report option. This is the same available format that is used for the On Screen Job Cost Analysis.
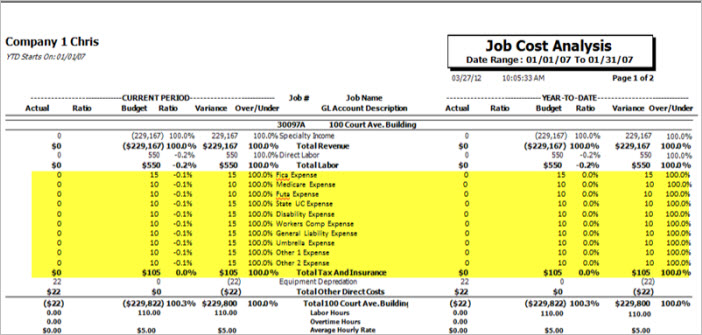
You can select to print the system calculated actual tax and insurance dollars on this report if the Taxes and Insurance check box for Tax Allocation by Job is selected on the Payroll Defaults (Misc tab) screen. For customers using the Payroll Tax Allocation program, the Payroll Taxes and Insurance details display on the Job Cost Analysis Report broke out by each tax code (provided that you have added the additional GL line items to the Job Cost Format).
You can filter, group, and print by Tiers, allowing for total customization of the report. To make filtering easier, for any Tier, you can include All, Pick/Create or Exclude parameters. Using Tier Templates to set up and save report templates makes it easy to generate a specific report each time you need it, without having to recreate the criteria. See Using Tier Templates for more information.

The Job Cost Analysis Report can be accessed from the JOB Reports menu.
Key Functionality
The JB Report Job Cost Analysis screen has its own Security Group, JOB Report Job Cost Analysis.
JB Report Job Cost Analysis screen is part of the JOB Reports ALL Security Group.
Tip: For more information see Security Groups Overview and Security Groups By Module.
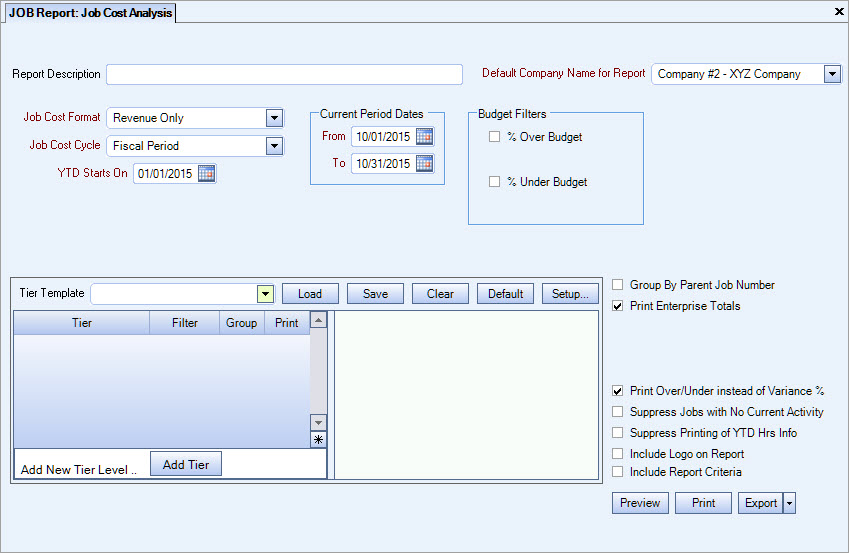
Type a description to name the report. This description prints above the Report Title.
The Default Company Name for Report is populated from the Company Setup screen. The list contains all companies for which you have security permissions to view. If you have permission for only one company, that will be the only one displayed in the list. If you have permissions to multiple companies, the list will display those companies PLUS the default reporting company.
When discernible, WinTeam will print the appropriate company name and logo on each page; otherwise the Default Company Name will print. That is, if a Company level is included in the tiered section and is displayed in the tiered information at the bottom of the page, then that company's Report Name and Logo (if selected) prints on that page.
If there is not a Company identified in the tier area of the page, then the Default Company Name for Reports is used. The default Company Name and Logo is also used for the Total Enterprise report. For more information see Learning about WinTeam Reports.
Select the format to use on the report: Detail Job Cost With T & I (Taxes and Insurance); Detail Job Cost Without T & I; Labor and Materials Only; Revenue Only. The formats available here were created with the Job Cost Report Templates.
Select the job cost cycle for the report. The available options were set up in the Job Defaults file.
Possible Job Cost Cycles are: Fiscal Period, Weekly, Bi-Weekly, and Semi-Monthly.
Select the beginning date for YTD information on the report.
The system defaults this date to the first day of the year entered in the Current Period From date. You can modify this date.
This field displays only if you select a Job Cost Cycle other than Fiscal Period.
Enter the revenue cut off date for the report.The date entered in the Current Period To date defaults here.
Use Budget Filters to view Jobs that are over or under budget by the percentage you define. If you select either option, a second field displays for entry of the percentage.
% Over Budget – Select to include Jobs that are over budget. The At least field displays for the entry of the minimum percentage over budget to include on the report.
% Under Budget – Select to include Jobs that are under budget. The At least field displays for the entry of the minimum percentage under budget to include on the report.
You can run the report to include work tickets in an Open or Pending status in addition to those in a Closed or Waived status. This helps you see when hours have been posted to job cost even if the work ticket hasn't been closed. The Pending, Waived, and Closed statuses are based on the Completion Date. The Open status is based on the Scheduled Date.
Note: Only Closed and Waived are selected by default. You must select Open or Pending if you want to see those work tickets.
Use the Tier Template to define and save customized settings for a report. To use an existing template, select the template from the list and click Load.
To create a new template, you can load an existing template, make the necessary modifications, click Save, and define a new template name in the Save As dialog box. Alternatively, you can start with a blank template by clicking the Clear button.
To modify an existing template, load the template, make the necessary modifications, and then click Save. The name of the existing template display in the Save As dialog box. Click OK.
For more information see Using Tier Templates and Using Tier Parameters.
(The tier template does NOT look at dated tiers.)
Select the Group By Parent Job Number check box to group all Child Jobs to the Parent Job on your report.
If selected, an additional check box Include Child Jobs becomes available. If you are using the Job Tier to limit the jobs included on the report, select this check box to automatically include all child jobs on the report (that exist for the jobs selected), rather than selecting them manually.
The Print Company Totals check box is available to users who have only one company, and may be selected to print company totals on the report.
The Print Enterprise Totals check box is available to users who have more than one company, and may be selected to print enterprise totals on the report. This check box is selected by default.
If this is not selected, the report prints only the tiered reports that are marked for printing.
This check box is visible if the Taxes and Insurance check box for Tax Allocation by Job is selected on the Payroll Defaults (Misc tab) screen.
Select this check box to include the system calculated actual tax and insurance dollars. If the Job Cost format that you are using includes a line using Type, Taxes and Insurance, the actual system calculated tax and insurance dollars will print.
If this check box is not selected, the On Screen Job Cost Analysis includes only the budgeted system calculated tax and insurance dollars.
If your Job Cost format is including the GL Accounts of your Tax Allocation journal, you will not want to select this check box, as this would overstate your payroll tax and insurance Actuals.
If this check box is NOT selected AND you are using the Tax Allocation program (Pay Defaults - Tax Allocation by Job is selected), the date entered in the System Calc T&I Cut Off will determine whether or not any system calculated Actual Tax and Insurance dollars will be picked up on the report.
Use this option to print the Over/Under percentage instead of the Sales Ratio Variance percentage. This allows you to see how far over or under budget you are for each particular line item. The normal percentage that prints (when this option is cleared) is the difference between Actual Sales Ratio and Budgeted Sales Ratio.
Select this option so that only Current Activity displays that is not equal to $0.00.
The default is NOT checked.
Note: If this option is selected and the current activity is excluded, this impacts the YTD amounts accordingly.
Select the Suppress Printing of YTD Hrs Info check box if you do not want YTD Hours information to print on the report.
Select this check box to print the company logo on the report. It is selected or cleared by default based on the option selected in SYS:Defaults. However, you can modify the setting on each report.
Select this check box to include a list of the report options selected for the report. The Report Criteria page includes any ranges specified and each Category/Record selection made for the report. This check box is cleared selected by default.
Preview
Click the Preview button (or use the shortcut key, ALT + V) to view the report before printing.
Click the Print button (or press ALT + P) to send the report to your default printer.
Export
Click the Export button (or press ALT + X) to export the report to a specified format. Reports may be exported to Adobe Acrobat (PDF), Excel, Comma-Separated Values (CSV), Grid View and E-mail (available for premise-based clients only).
Actual
The "Actual" column is from the General Ledger Detail File and totaled according to the G/L Account numbers in the Job Cost Format.
Ratio
The "Ratio" column is the Actual Dollars / Total Actual Revenue. The Total Revenue Line is normally 100%.
Budget
This is the total budgeted dollars for the level indicated. The Budget figures are based on the Daily Budgets for each Job, the budgeted hours entered in Work Scheduling, and the General Ledger Budgets for each Job.
Ratio
The "Ratio" column is the Budgeted Dollars / Total Budgeted Revenue. The Total Revenue Line is normally 100%.
Variance
A Negative Variance is BAD!
This is the difference between the Actual $ and Budgeted $. A negative variance means that the Actual expense amount is more than the Budgeted amount or that the amount billed was less than the budgeted amount. A positive variance means that the Actual expense amount is less than the Budgeted amount or that the amount billed is more than the amount budgeted.
Calculation: Actual $ - Budget $ = Variance
|
Example |
Actual Expense |
3940 |
|
|
- Budget Expense |
4700 |
|
|
= Variance |
759 |
The variance is less than the budget! (Good Variance)
Over /Under
The Over/Under percentage is calculated by dividing the Variance by the Budget dollars.
Job Name Totals
This is the difference between Revenue total and Expenses. A positive amount indicates Revenue exceeds Expenses. A negative amount indicates Expenses exceed Revenue. Both the Actual and Budget column use this same calculation.
Calculation: Revenue – Labor – Material – Other Direct Cost = Actual $
Labor Hours
This is the total amount of hours worked and budgeted for this job. The Actual Hours represent all hours paid for the time frame of the report. The budget hours are from the Jobs Budget Detail screen and are based on the number of working days and hours for the job. The Actual hours include any overtime hours.
Overtime Hours
This is the total amount of "Half Time" hours paid to employees for any overtime hours worked. This is only the penalty for an employee going into overtime. This total DOES NOT include the regular hours.
Example: For example: Employee is paid 40 regular hours and 8 overtime hours.
Labor Hours is 48
Overtime Hours is 4
Average Hourly Rate
This rate is calculated at the time this report processed by taking the Actual Labor dollars divided by Labor Hours.


