
Overview
The Checkpoints window is accessed from the Quality Assurance Menu, the Checkpoint Review (Results tab), and the Deficiency Review window.
Checkpoints can be used to create & respond to questions, act based on responses, and share results.
Checkpoints are created based on an existing Checkpoint Template.
Use the Checkpoint window to create a Checkpoint, complete an 'In Progress' Checkpoint, or view a completed Checkpoint.
Blank and Completed Checkpoints can be printed using the Checkpoints Report.
An e-mail notification can be sent automatically alerting an e-mail recipient after a Checkpoint has been marked as Completed. The notifications contain links to view the Checkpoint details and Deficiencies. Area-level items are included in the notification's attached PDF.
Tip: For more information see Security Groups Overview and Security Groups By Module.
Additional Checkpoint Security information for eHub users.
Checkpoints window
Key Functionality
The QA Checkpoints window does not have its own Security Group.
The QA Checkpoints window is part of the QA ALL Security Group.
The following security features are available for this window:
-
Cannot Change Completed Checkpoint - A User with the Cannot Change Completed Checkpoint feature assigned cannot update a completed checkpoint, nor can they delete a completed Checkpoint.
-
Cannot Delete Completed Checkpoint - A User with the Cannot Delete Completed Checkpoint feature assigned cannot delete a completed checkpoint.
- Cannot eHub Publish - A User with the Cannot eHub Publish feature assigned cannot publish the checkpoints to eHub.
- Read-Only
For more information see Learning about Read-Only Security.
Note: If a completed checkpoint has a signature captured, the checkpoint cannot be deleted.
Click the Advanced filter button to create or edit a filter for finding and/or sorting specific records. You can also select a Saved filter. Click the Apply Filter/Sort button to apply any filter or sort criteria you created. Click the Remove Filter/Sort button to remove a filter or sort, if one is currently applied. For more information see Advanced Filtering.
You can rollover (copy) an existing Checkpoint by using the Rollover button from the toolbar.
If the Checkpoint you are rolling over from has a 'Completed' Status, the new Checkpoint will have a Status of 'In Progress' and any previous scoring is removed. Adjust the header information as necessary. Once the header is saved, the next available ID number is assigned to the Checkpoint.
For more information on see Rollover Functionality.
Type the ID of the Checkpoint record in this field, or use the Lookup to locate an existing Checkpoint.
The system uses the ID field to identify each record. The system automatically assigns an ID to each new record.
Hover over the Change Information icon to see User Added, Date Added, User Changed and Date Changed information. WinTeam records the logon name of the user entering or changing this record. The Date Added is the original date this record was entered into the system. The Date Changed is the date the record was last changed. Right-click on the Change Info icon to filter for records added or changed by a specific user or date.
When you hover over the User Changed or Date Changed filters, you can:
- Filter By Selection - Filters for all records that match your current records field value.
- Filter by Exclusion - Excludes from your filter all records that match your current records field value.
- Filter For - Filters based on the text/value you enter.
- Sort Ascending - If you already have a filter applied, the Sort Ascending command is available. Also used to include all records in the filter and sort in ascending order based on the current records field value.
- Sort Descending - If you already have a filter applied, the Sort Descending command is available. Also used to include all records in the filter and sort in descending order based on the current records field value.
Enter the Job Number that uses this Checkpoint, or use the Lookup to locate the Job Number.
Select the Checkpoint Template to use as a basis for this Checkpoint.
Only templates that are available to this Job display in this list, as designed by the Template.
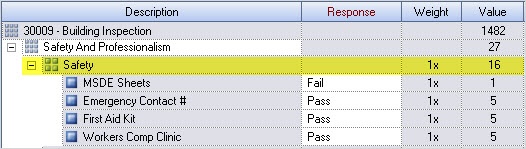
Example: The Checkpoint Template being used for this Job is the 'Building Inspection' Template. The Building Inspection' Template does not exclude this Job, therefore it is available for Job 30009.
The Building Inspection Template does not exclude Job 30009 by Tiers or by direct exclusion (Job Numbers grid), so it displays in the Templates list.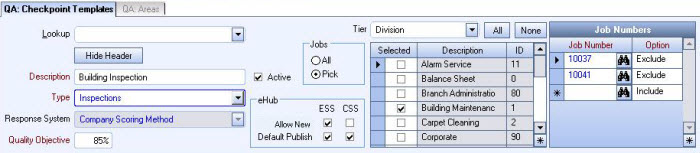
The Templates Available for a Job also display in the Job Master File (Quality Assurance tab) for each Job.
The Template list contains the Description of the template, the Type of template, the ‘Notes’ field from the template and the Template ID.

Once a Template is selected, the tree view populates based on the template.
If you double-click in the Template field (with an entry), the selected Checkpoint Template window displays.
If you double-click in the Template field (without an entry), a new Checkpoint Template window displays.
If you attempt to select a Template without first entering a Job Number, no Templates display in the list.
Select who is to perform the Checkpoint.
- If an Employee is to perform the Checkpoint, enter the Employee Number, or use the Lookup to locate the Employee Number.
- If a Contact is to perform the Checkpoint, enter the Contact Number, or use the Lookup to locate the Contact Number. The Contacts in this Lookup display only those Contacts assigned to the currently selected Job. Contacts can be subcontractors or other third-party individuals who perform Checkpoints. They are not Employees, nor are they CSS Users. Contacts represent the smallest percentage of Checkpoint users.
- If a CSS User is to perform the Checkpoint, enter the CSS User Name, or use the Lookup to locate the Customer Contact. CSS Users will primarily complete surveys and inspections.
On a new Checkpoint or a Checkpoint that has not been Completed, the Status displays 'In Progress'.
Once the Finish button is selected the Status changes to 'Completed'.
The Status field is read-only and cannot be changed.
If a Completed Checkpoint is modified, 'Modified' displays in green text above the Status.

Click Send Notification to send an email notification of a completed checkpoint.
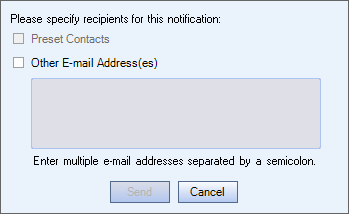
Preset Contacts are set up in the Quality Assurance tabunder the Available Templates Contact column. You can enter other email addresses to send a notification to.
There are four different email/PDF formats to choose from. See QA: Checkpoint Email/PDF Reporting Options for details.
Roll over this icon to display the Send Notification status.
Select a Site to associate a Checkpoint with a specific area of a building.
Only the Sites added to the selected Job Master File (Quality Assurance tab) display in this list.
You can double-click in the Site field to open the selected Job Master File with focus on the Quality Assurance tab.
If a Site is set up in the Job Master File, and a Checkpoint is created in eHub (Web or Mobile), the Site is a required entry in eHub.
Enter the Date the Checkpoint is completed. Defaults to today's date.
Enter the time the Checkpoint was performed.
Type the Employee Number, or use the Lookup to locate the Employee Number, to associate the employee to a QA:Checkpoint.
Note: The employee that the check point is performed on does not see the checkpoint. Not to be confused with the employee who completes (Performed By) the checkpoint.
Select to publish in eHub to employees (Emp), supervisors (Super) or clients (CSS). If selected, the Completed Checkpoint automatically shows in eHub.
Enter any notes relevant to this Checkpoint.
When Expand All is selected, the entire Checkpoint displays, including all Items.
When Collapse All is selected, the entire tree of the Checkpoint is reduced to the first Area level.
These buttons do not have functionality on a new Checkpoint (before the header is saved).
The Finished button displays once the header has been saved and the Status is 'In Progress'.
It does not display on a Completed Checkpoint.
Checkpoint grid
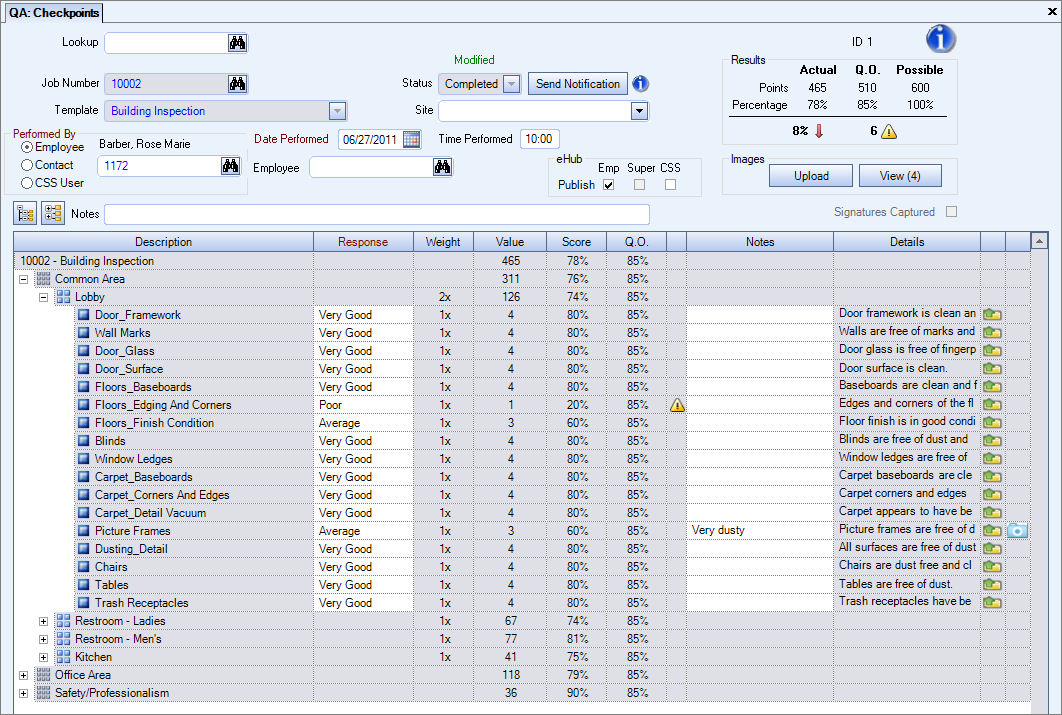
Once the header information is entered, the Checkpoint grid populates with the details from the selected Template.

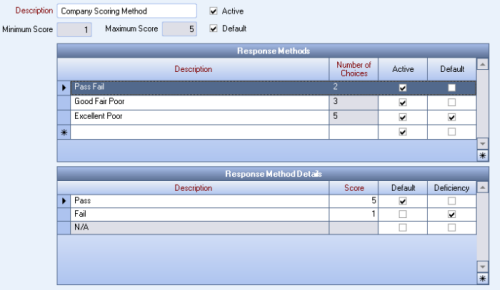
If a default selection was made for the Response Method, it displays in the Response column.
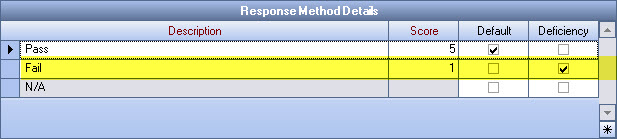
The Company Scoring Method is used for this Checkpoint. The Company Scoring Method has a Pass Fail Response Method. The Pass Fail Response Method defaults to 'Pass'.
When a Checkpoint is completed, the Score for the Response is used (along with Weight) to calculate the Value of each Item.
Once all Items have been scored and Notes entered, if applicable, click the Finished button to calculate the results of the Checkpoint.
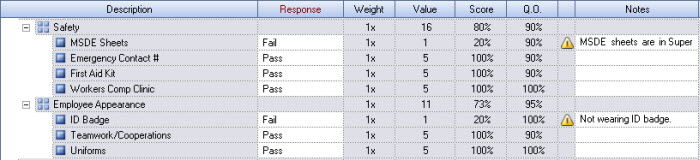
- A summary of the Results display showing Points and Percentages for Actuals, Quality Objectives, and Possible. The Results area also displays the number of Deficiencies in the Checkpoint and the difference between the Actual Percentage and the Quality Objective Percentage.
- The Weight, Value, Score, and Quality Objectives columns also display.
The Results area matches the Checkpoint level in the grid. The results for the Checkpoint are the sum of the Sections, which include all Items. These results are included on the eHub Dashboard.
The results for the Area are the sum of its Items.
The results for the Section are the sum of its Areas.

Weight
Weights are not applicable at the Section or Checkpoint levels as they are a part of the calculated Value.
Areas and Items display the Weight assigned from the Template.
Value
For an Item, the Value is the Value of the Response multiplied by the Item Weight.

For an Area, the Value is the sum of all Items * Area Weight.
For a Section, the Value is the Total of Areas.

The total of all Areas under the Safety and Professional Section is 27.
Safety (16) + Employee Appearance 11+ = 27 for a Section Value.
For a Checkpoint, the Value is the Total of all Sections.

Score
The Score for an Item is its Value divided by Possible Points.
The Item MSDE Sheets has an Item Value of 1. The Possible Points are 5.
Calculation: 1 (Item Value ) / 5 (Possible Points) = 20% Score.
The Safety Area has a Value of 16.
Calculation: 16 (Area Value ) / 20 (Possible Points) = 80% Score.
The Safety and Professionalism Section has a Value of 27. The Possible Points are 35.
Calculation: 27 (Section Value ) / 35 (Possible Points) = 77% Score.
The Building Inspection Checkpoint has a Value of 1482. The Possible Points are 1830.
Calculation: 1482 (Checkpoint Value ) / 1830 (Possible Points) = 81% Score.
Quality Objectives
The Quality Objectives are derived from the Checkpoint Template associated with the Checkpoint.
Deficiencies
If the Deficiency check box was selected for a specific Score in the Response Method Details, the Item displays as a Deficiency whenever an Item is scored with that result.
The number of deficiencies is included in the Results area.

Double-click the deficiency icon in the Checkpoint to open the Deficiency Review window. The Items display with an Open Status. You can decide how you want to handle the Deficiency (Create a Work Ticket, Assign a Work Ticket, or Close the Deficiency) directly from the Deficiency Review window.
Note: Responses which are marked as deficient will require notes to be entered. If no notes are entered, an error message displays.
Results
- Actual Points are the actual Value for all Sections (1482)
- Actual Percentage is Section Values (1482) / Total Possible Points (1830) = 0.8098 (shown as a 81%)
- Q.O. Points are Possible Points (1830) * Checkpoint QO (85%) = QO Points (1556)
- Q.O. Percentage is not calculated, it is based on the Checkpoint Template
- Possible Points are the total value if a user were to score the highest possible value (max point value) for each Item
- Possible Percentage is not calculated and is always 100%
% Above  /Below
  Target
Indicates percentage that the actual (achieved) point value is above or below the Quality Objective percentage (target). An up/down arrow is used to indicate if the item is above or below Quality Objective.
 Deficiencies
Indicates a count of deficiencies. If there are no Deficiencies this icon does not display.
 Upload button
Click the Upload button to begin browsing for, selecting, and attaching an image to a Checkpoint item.
 Image Viewer
The Image Viewer button displays only if an image is attached to a Checkpoint item. It displays the image count when the mouse rolls over the button. Click the button to launch the Checkpoint Images window.