Overview
Checkpoints are a part of a Quality Assurance solution that allows eHub users to complete inspections or surveys. This feature is available for both Employee Self-Service (ESS) and Customer Self-Service (CSS) users. For more information on which checkpoints users have access to, see eHub: Understanding Checkpoint Security and Permissions.
Key Functionality
Checkpoints are accessed from the Checkpoints widget on the Main or Job landing pages (for Supervisor and Customer license access) or from the My eHub or Job landing page (for Employee license access).
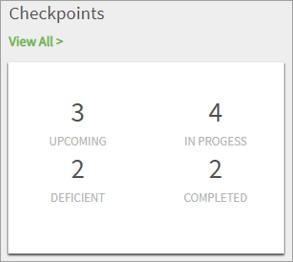
The Checkpoints widget displays the totals for Upcoming, In Progress, Deficient and Completed checkpoints.
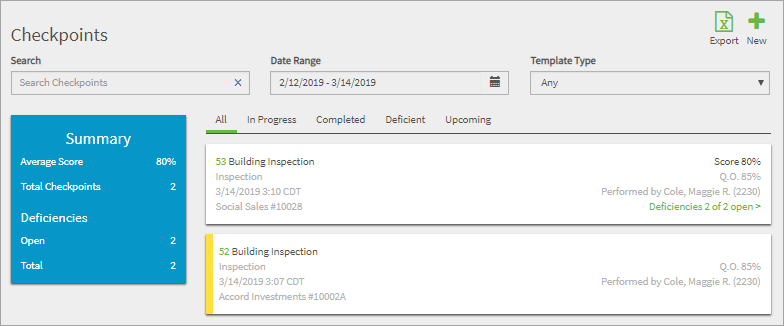
Click a total link to view the checkpoints that meet that criteria, or click the View All link to display all in progress checkpoints from the last 30 days. From this Checkpoint landing page you can view a completed checkpoint, finish a checkpoint that is in progress or create a new checkpoint.
Click the Export icon ![]() in the top right corner of the window to export the information into a spreadsheet. The spreadsheet is automatically saved as a Microsoft Excel Worksheet (.xlsx) to the default download location on your computer or network.
in the top right corner of the window to export the information into a spreadsheet. The spreadsheet is automatically saved as a Microsoft Excel Worksheet (.xlsx) to the default download location on your computer or network.
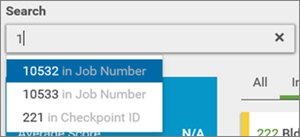
You can filter results by searching by job name/number, employee name/number or Checkpoint ID. The search only displays results based on the other filter criteria.
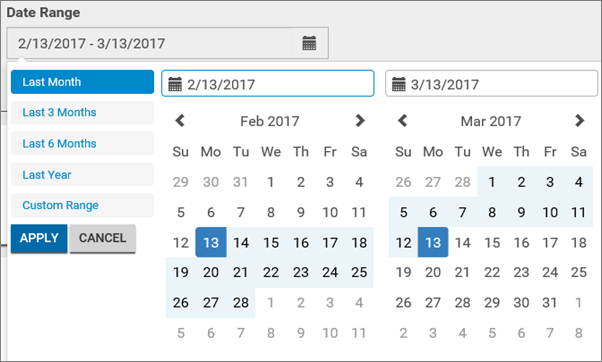
The date range filter defaults to display the last 30 days. Click the calendar icon to display other date range selections. Available selections are Last 30 Days, Last 90 Days, Last 6 Months, Last Year and a Custom Range. If you select the custom range option, a calendar opens allowing you to select your specific dates. When you have selected your custom date range, click the Apply button to display the filter to the Checkpoints screen.
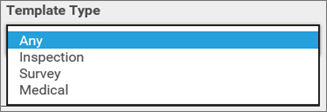
The Template Type field can be used to filter for selected template types. Click in the Template Type field to view a drop-down list of the options available.
From the Checkpoints screen, select the All tab to display all checkpoints, regardless of the status.
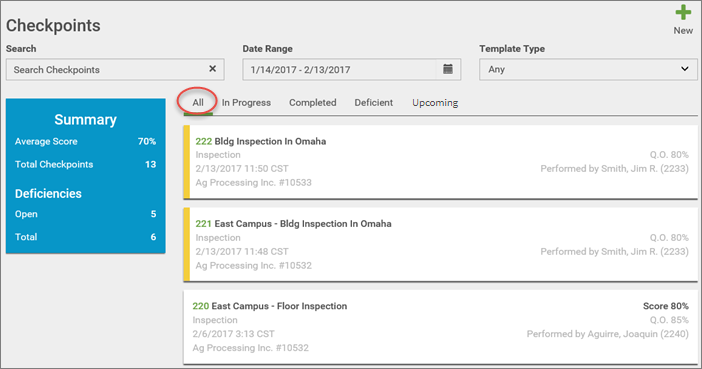
From this view, you can click the green checkpoint ID to display additional checkpoint details.
From the Checkpoints screen, to view only in progress checkpoints, select the In Progress tab to apply this filter.
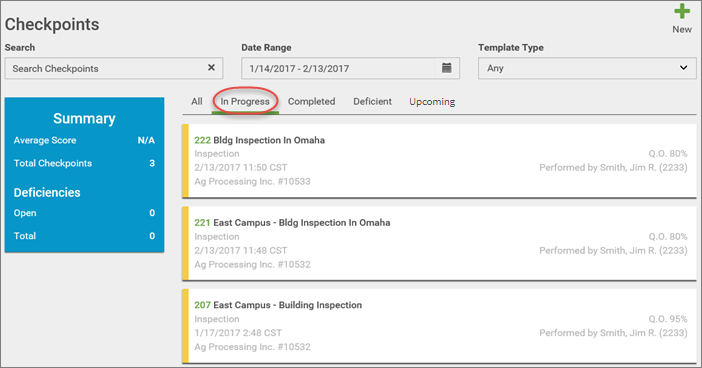
From this view you can click the green checkpoint ID to continue with the checkpoint process.
From the Checkpoints screen, to view only completed checkpoints, select the Completed tab to apply this filter.
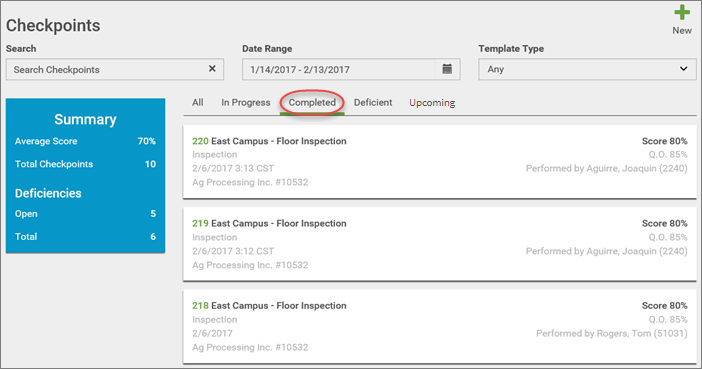
From this view you can click the green checkpoint ID to display additional checkpoint details.
From the Checkpoints screen, to view only deficient checkpoints, select the Deficient tab to apply this filter. Checkpoints display if there is one or more deficient.
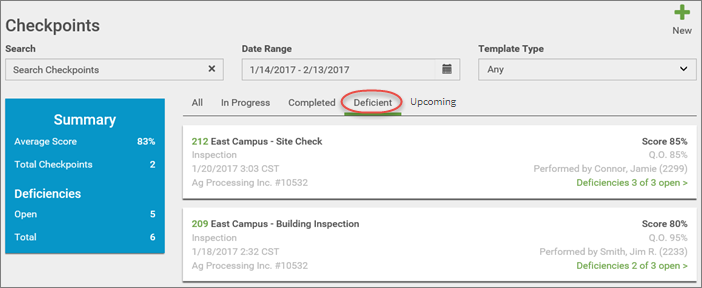
From this view you can click the green checkpoint ID to display additional checkpoint details, or you can click the green deficiencies link to be directed to the deficiencies screen.
From the Checkpoints screen, to view only upcoming checkpoints, select the Upcoming tab to apply this filter. Checkpoints templates display if there is one or more upcoming.
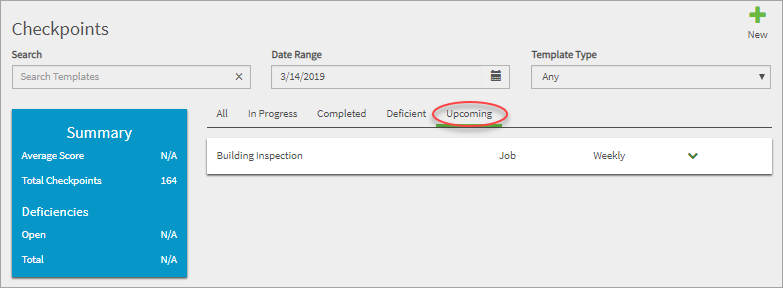
In this view use the drop down arrow to view the individual checkpoints. Click the plus sign to display the Create Checkpoint view. Here you can click the button to create a checkpoint that has not yet been created.
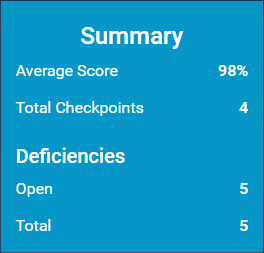
A summary for Checkpoints displays based on your filter criteria. The summary information includes the average score, total checkpoints, as well as the number of open deficiencies and total number of deficiencies. You must have eHub security screen QA Checkpoint Summary for this summary to display.
The checkpoint card displays the checkpoint ID, sites (if applicable), template, template type, date the checkpoint was created, job name/number, as well as the performed by information and quality objective percentage. Completed checkpoints also displays the score percentage and deficiency information. In progress checkpoints have a yellow indicator on the left side of the card.
Click the green checkpoint ID to display the checkpoint.

The Results summary displays for completed checkpoints. The summary includes the total Points given and total Points available, the quality Objective percentage, the Actual percentage, as well as the percentage points above or below the quality Objective . If deficiencies exist for this checkpoint, the count displays.
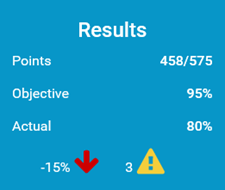
The individual Checkpoints screen also displays the Site, Employee, and Notes (if applicable).

Below the checkpoint header the review information displays.
Note: The Performed On time is always the server time which is in the CST/CDT time zone. The time that displays is when the information was saved to the server which is why the server's time zone always displays. The CST or CDT depends on the time of year.
Anything submitted spring to fall would be CDT while anything submitted fall to spring would be CST.
Click the left or right arrows to cycle through Checkpoint Areas. Items for each area display.
Note: The Section name displays in addition to the Area name in the heading if Sections are configured in QA: Checkpoint Templates.

