Overview
The Sales Details screen displays after clicking the Sales Detail button on the Customer Master File screen. This screen displays on top of the Customer Master File screen.
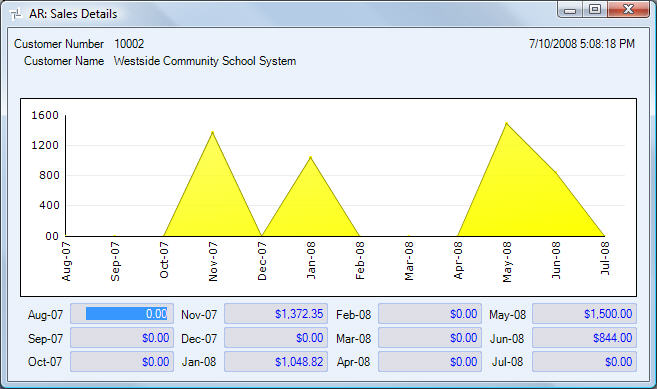
The Sales Detail screen displays a graph of the activity for the current period and prior 11 or 12 periods sales, as well as a numerical display of the graphed figures. The graph displays in sales dollars by period based on the Posting Date of invoices. Below the graph, each month (beginning with the twelfth month back and displaying through the current month) will also display.
You can hover over a point on the graph to display the sales amount for that period.
You can also double-click on each period amount to display the AR: Invoice Review screen filtered for invoices in the selected period.
Sales Details screen

Related Information
Key Functionality
Graph
This graph shows the last 12 month's sales activity for the Customer.
Months
Displays each month's sales figures.
