
Overview
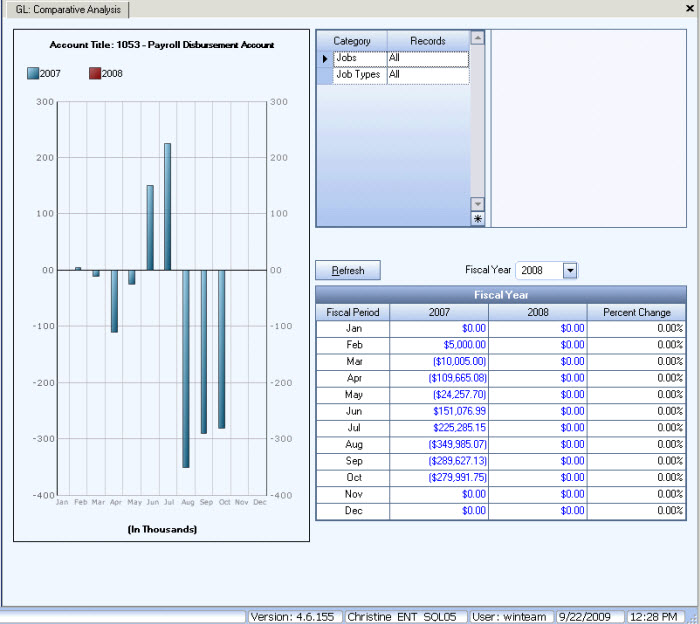
The Comparative Analysis screen displays a graph of the account history for the current year and the prior year. The balance of the account each month for the current year and past year also displays with the percentage change between years. Prior year balances may also be viewed on this screen by changing the years displayed.
Double-click in an amount field to view Transaction Details for the selected fiscal period.
A key to the colors used and the years they represent display in the upper right corner of the graph. If you make changes to the years displayed on the screen, click the Refresh button to requery the Fiscal Year totals and update the graph accordingly.
You can access the Comparative Analysis screen from the Chart of Accounts screen.
Key Functionality
Category/Records
Jobs
Use the Jobs category to select the Jobs to include on the report.
Select All to include all Jobs.
Select Range to define a range of Jobs for the report. When you select Range, the range fields display. Type the beginning Job Name or Number in the From field and the ending Job Name or Number in the To field.
Select Pick to define specific Jobs for the report. When you select Pick, the Jobs list displays. Select the check box next to each Job to include on the report.
Select Create to define your own list of Jobs. When you select Create, a small grid displays to the right. Enter the Job Numbers you want to include in the list, or use the Lookup to locate the Job Numbers.
Select Exclude to identify records that should not be included. When you select Exclude, a small grid displays to the right. Enter the Job Numbers you want to exclude in the list, or use the Lookup to locate the Job Numbers.
Job Types
Use the Job Types category to select the Job Types to include on the report.
Select All to include all Job Types.
Select Pick to define specific Job Types for the report. When you select Pick, the Job Types list displays. Select the check box next to each Job Type to include on the report.
Refresh button
Click the Refresh button (or press ALT + R) to reflect changes to the Comparative Analysis when you change the Fiscal Years, Jobs, or Job Types selections. The system recalculates and displays the graph based on the current selections.
Fiscal Year
Select the current fiscal year for the report.
Fiscal Period
The Fiscal Period column displays the periods beginning with the first period for the listed fiscal year. For most customers this is the first month in the fiscal year, followed consecutively by the next 11 (eleven) months. For those customers using a 13 (thirteen) period year, each of the 13 periods will display. The fiscal periods correspond to the period dollar values displayed on the right.
Fiscal Year
The Fiscal Year columns display the current and previous fiscal years for the Comparative Analysis. The previous fiscal year displays in the first column and the selected fiscal year displays in the second column.
To view a different combination, change the fiscal year. The first column changes accordingly. Click Refresh >to update the graph if you change the Fiscal Year.
To view additional detail for the entries that make up a period total, double-click on the period amount in question. The Transaction Details screen displays.
Percent Change
The Percent Change column displays the difference between the fiscal years for each period. If there are no values to compare, the field is blank. Negative percentages (decreases) display with a negative sign (-).