Retention
Note: The information in the retention widgets apply to hourly employees only. Data in these widgets is refreshed on the first week day of each month.
Widgets
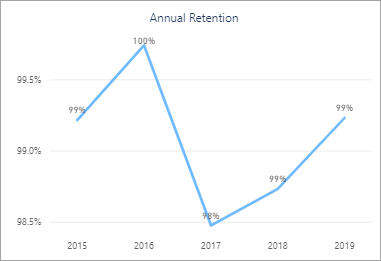
What information is in this widget?
This widget contains the percentage of employees who are retained annually.
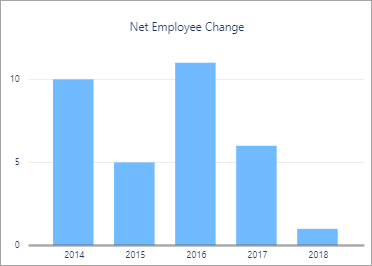
What information is in this widget?
This widget contains the net employee change.
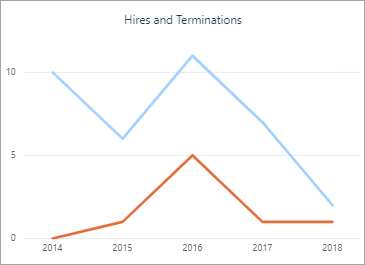
What information is in this widget?
This widget contains the number of employees who were hired and terminated.
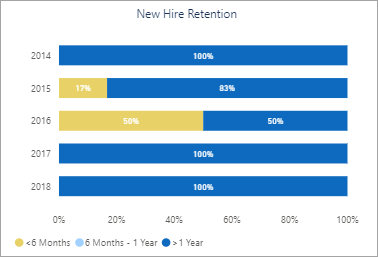
What information is in this widget?
This widget contains the percentage of new employees who are retained.
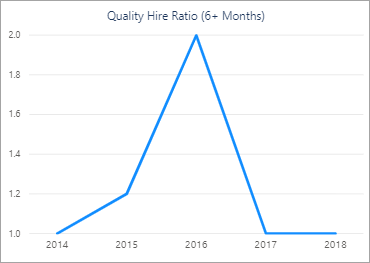
What information is in this widget?
This widget contains the quality hire ratio for six or more months.
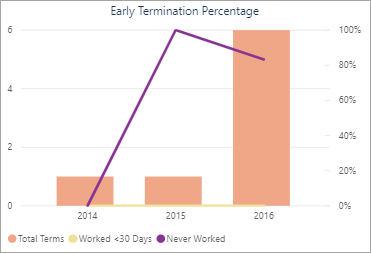
What information is in this widget?
This widget contains the percentage of employees who are terminated early.
What information is in this widget?
This widget contains the percentage of active employees by generation.
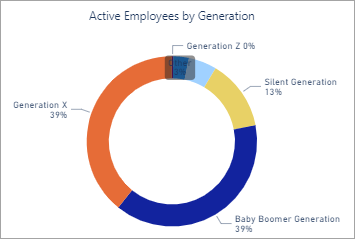
| Category | Definition |
|---|---|
| The Silent Generation | Born 1928 – 1945 |
| Generation W (Baby Boomers) | Born 1946 – 1964 |
| Generation X | Born 1965 – 1980 |
| Generation Y (Millenials) | Born 1981 – 1996 |
| Generation Z (iGen or Centennials) | Born 1997 – 2012 |
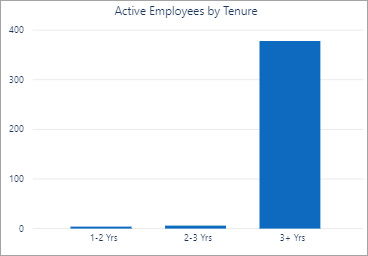
What information is in this widget?
This widget contains the number of active employees based on tenure.
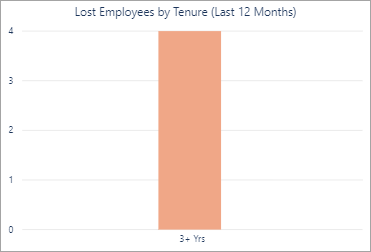
What information is in this widget?
This widget contains the number of lost employees in the last twelve months based on tenure.
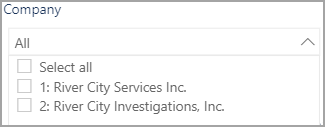
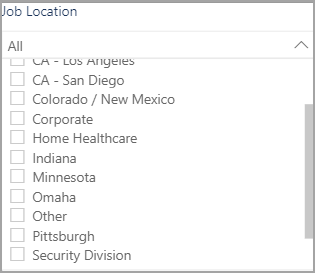
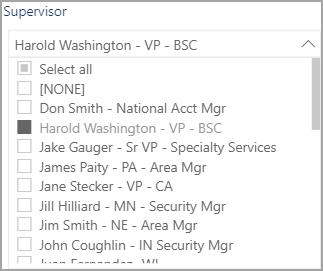
Filters
Data for all records displays in the widgets by default. Use the filters at the top of the page to select specific records and display data just for the selected records in the widgets. Click the check box to the left of the record to select that record. Press the Ctrl key while clicking the check boxes to select multiple records. Click Select all or All at the top of the filter list to select all records—click it again to clear all records. Some of the filters have an eraser icon in the right corner you can also click to remove all filters.
Some of the filters also have a Search field you can use to locate a specific record using the name or ID number.

Options
| Option | Action |
|---|---|
Drill Up

|
Collapse expanded levels of the hierarchy |
Go to the next level in the hierarchy

|
Drill down one level in the hierarchy |
Expand all down one level in the hierarchy

|
Expand all levels of the hierarchy |
Focus Mode

|
Expand the widget to display in the entire window. Click Back to Report to return to the summary display. |
More Options

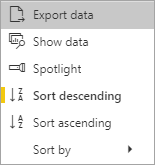
|
Click the ellipsis to open the More Options menu. A vertical yellow bar displays to the left of selected options. |
| Export Data | Export widget data in a .xlsx (Excel) or .csv (Comma Separated Values) format. See Exporting Data for details. |
| Show Data | Expand the widget to display in the entire window and see the data with the visualization. When a widget is in the Show Data view, you can use the switch to vertical layout and switch to horizontal layout options in the upper-right corner to change the position of the data and visualization.   Click Back to Report to return to the summary display. |
| Spotlight | Bring visual focus to the selected widget by dimming the other widgets. Click Spotlight again to return to the default view. |
| Sort Descending/Sort Ascending | Arrange the information in the widget in alphabetical order either descending (Z-A) or ascending (A-Z). |
| Sort By | Arrange the information in the widget using bases that are unique to each widget. The options in the Sort By sub-menu vary depending on the widget. |
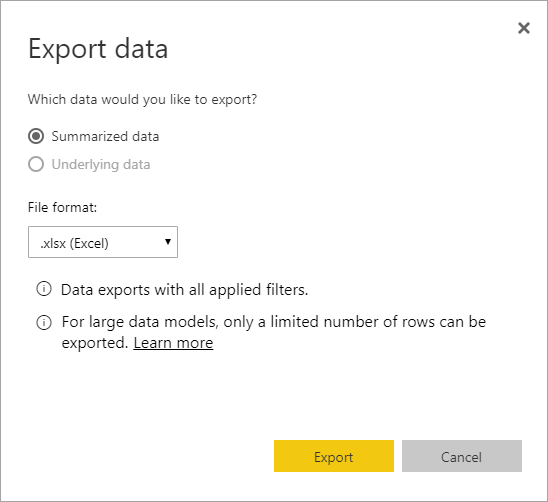
Data in the reports can be exported in a .xlsx (Excel) or .csv (Comma Separated Values) format. The option to export report data is in the More Options menu that in located in the upper-right corner of each report. The summarized data exports the information from the display view with all applied filters. The underlying data export is not enabled for any user. For large data models, only a limited number of rows can be exported. Learn more