Personnel
Widgets
What information is in this widget?
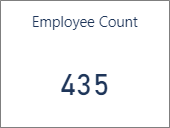
This widget contains the number of employee records with a status of Active or Leave of Absence.
What information is in this widget?
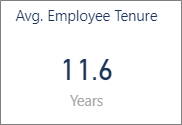
This widget contains the average length of time in years that an employee is employed.
How are these values calculated?
Average employee tenure is calculated using the Hire Date for employees who have a status of Active or Leave of Absence.
- Tenure in days is calculated for a single employee by subtracting their hire date from the last data refresh date (yesterday’s date)
- Tenure in days is summed for all active/leave of absence employees
- The total tenure in days is divided by the number of employees and this number is divided by 365 to calculate tenure in years
What information is in this widget?
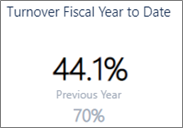
This widget contains the percentage of employees who have left their employment and been replaced by new employees in the current fiscal period (to date) and the previous complete fiscal period.

Average Employee Count includes employees with a status of either Active or Leave of Absence. Employees lost includes employees with a status of Inactive and that Inactive status is also marked Include in Turnover in the Status Reasons.
Note: There are slight differences in the turnover calculation used in the Employee Termination and Turnover report so the value may not be the same as the value in the Insights Dashboard.
How are these values calculated?
The turnover calculation for the current fiscal period:
Average Employee Count = (employee count at start of fiscal period + employee count on last refresh date) / 2
Turnover Percentage = employees lost during fiscal period / average employee count x 100
The turnover calculation for the previous fiscal period:
Average Employee Count = (employee count at start of fiscal period + employee count at end of fiscal period) / 2
Turnover Percentage = employees lost during fiscal period / average employee count x 100
The fiscal periods and years used in the Insights Dashboard are those you set in the Fiscal Year Setup window in WinTeam. In the Insights Dashboard, the current fiscal period or year is the beginning date of the period or year through the last refresh of the data (the previous day).
The number of employees lost is the number of inactive events (an employee’s status being switched to inactive) during a fiscal period or year. Examples of inactive events:
An employee activated and inactivated within a period would counts as one lost employee
An employee who was inactivated, reactivated, and inactivated again during the period counts as two lost employees
An employee who was active at the period start, inactivated during the period, and reactivated before the end of the period counts as one lost employee
148 employees at start of fiscal period
137 employees at end of fiscal period
26 employees lost during fiscal period
Average Employee Count (148 + 137) / 2 = 142.50
Turnover Percentage (26 / 142.50) x 100 = 18.25%
What information is in this widget?
This widget contains the percentage of employees who have left their employment and been replaced by new employees in the current fiscal year (to date) and the previous complete fiscal year.
Average Employee Count includes employees with a status of either Active or Leave of Absence. Employees lost includes employees with a status of Inactive and that Inactive status is also marked Include in Turnover in the Status Reasons.
Note: There are slight differences in the turnover calculation used in the Employee Termination and Turnover report so the value may not be the same as the value in the Insights Dashboard.
How are these values calculated?
The turnover calculation for the current fiscal year:
Average Employee Count = (employee count at start of fiscal year + employee count on last refresh date) / 2
Turnover Percentage = employees lost during fiscal year / average employee count x 100
The turnover calculation for the previous fiscal year:
Average Employee Count = (employee count at start of fiscal year + employee count at end of fiscal period) / 2
Turnover Percentage = employees lost during fiscal year / average employee count x 100
The fiscal periods and years used in the Insights Dashboard are those you set in the Fiscal Year Setup window in WinTeam. In the Insights Dashboard, the current fiscal period or year is the beginning date of the period or year through the last refresh of the data (the previous day).
The number of employees lost is the number of inactive events (an employee’s status being switched to inactive) during a fiscal period or year. Examples of inactive events:
An employee activated and inactivated within a period would counts as one lost employee
An employee who was inactivated, reactivated, and inactivated again during the period counts as two lost employees
An employee who was active at the period start, inactivated during the period, and reactivated before the end of the period counts as one lost employee
148 employees at start of fiscal year
137 employees at end of fiscal year
74 employees lost during fiscal year
Average Employee Count (148 + 137) / 2 = 142.50
Turnover Percentage (74 / 142.50) x 100 = 51.93%
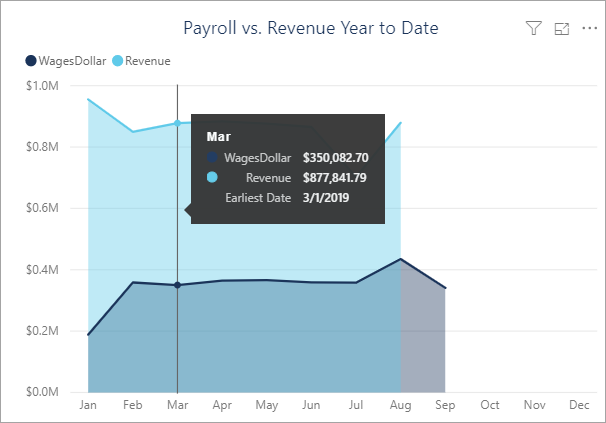
What information is in this widget?
This widget contains a visualization of the comparison between revenue from General Ledger postings with a type of income and wages from paychecks for each month during the current year. In WinTeam, the wages value can be found in the Payroll Check History report, when you run the report using the same date filters. The wage total equals paychecks with a check date during the respective month, and a sum of the taxable earnings for each paycheck. The revenue value can be found in the General Ledger Detail report, when you run the report for income accounts, set the Posting Dates to the appropriate months, and do not select Financial Report Format.
What information is in this widget?
This widget contains a breakdown of the employees who had a status change. It is grouped by the employee’s status after the change. The chart shows this data over the last three years.


Employee #624 has two status changes in 2019:
Hired on 2/11/2019 (Active)
Goes on medical leave starting 10/7/2019 (Leave of Absence)
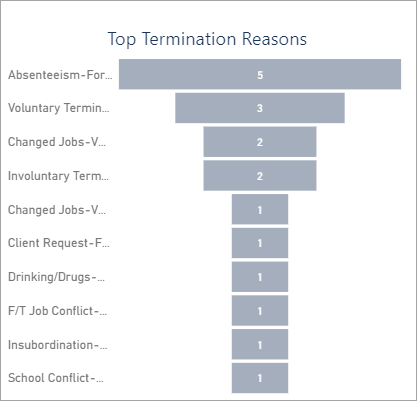
What information is in this widget?
This widget contains the reasons why employees were terminated. In WinTeam, these reasons are setup in the Status Reasons window which opens from the Status Info tab of the Employee Master File. You could run the Employee Termination and Turnover report, filter for the same status reasons, then export the report to Excel to further compare the results.
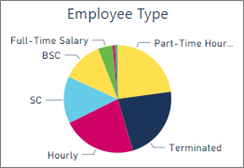
What information is in this widget?
This widget contains a breakout of the count of Active and Leave of Absence employees by the employee’s type.
The Employee Type is set in the Employee Master File in WinTeam. This count by employee type can be validated by running the Employee Master Report with the following settings:
Report Format of Detail
Employee Status of Active and Leave of Absence
Job Status of Both
Birth Dates of All
Group By Employee Type
Show Count is selected
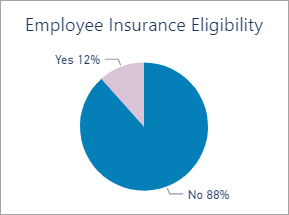
What information is in this widget?
This widget contains a breakout of the count of Active and Leave of Absence employees based on whether they are eligible for insurance.
This number comes from the Other Info tab of the Employee Master File in WinTeam. An employee’s eligibility is counted towards Yes if they have at least one of the Insurance Type 1, Insurance Type 2, or Insurance Type 3 fields checked. Conversely, they are marked as No if all these fields are blank. The Advanced Filter can be used to validate these numbers.
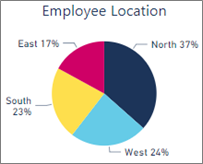
What information is in this widget?
This widget contains a breakout of the count of Active and Leave of Absence employees based on the employee’s location.
This number can be validated in the Employee Master report by using an advanced filter to include only employees with a Current Status of Active or Leave of Absence and selecting a specific location name as a second filter.
What information is in this widget?
This widget contains a breakout of the count of Active and Leave of Absence employees by the employee’s classification.
The employee’s classification is set in the Employee Master File in WinTeam. This count by classification can be validated by running the Employee Master Report with the following settings:
Report Format of Detail
Employee Status of Active and Leave of Absence
Job Status of Both
Birth Dates of All
Group By Classification
Show Count is selected

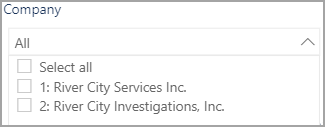
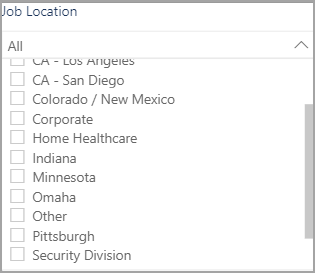
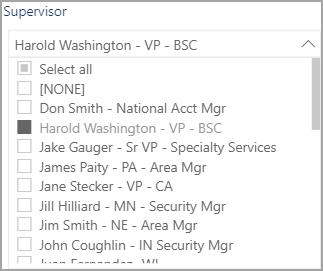
Filters
Data for all records displays in the widgets by default. Use the filters at the top of the page to select specific records and display data just for the selected records in the widgets. Click the check box to the left of the record to select that record. Press the Ctrl key while clicking the check boxes to select multiple records. Click Select all or All at the top of the filter list to select all records—click it again to clear all records. Some of the filters have an eraser icon in the right corner you can also click to remove all filters.
Some of the filters also have a Search field you can use to locate a specific record using the name or ID number.

Options
| Option | Action |
|---|---|
Drill Up

|
Collapse expanded levels of the hierarchy |
Go to the next level in the hierarchy

|
Drill down one level in the hierarchy |
Expand all down one level in the hierarchy

|
Expand all levels of the hierarchy |
Focus Mode

|
Expand the widget to display in the entire window. Click Back to Report to return to the summary display. |
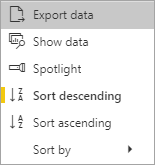
More Options

|
Click the ellipsis to open the More Options menu. A vertical yellow bar displays to the left of selected options. |
| Export Data | Export widget data in a .xlsx (Excel) or .csv (Comma Separated Values) format. See Exporting Data for details. |
| Show Data | Expand the widget to display in the entire window and see the data with the visualization. When a widget is in the Show Data view, you can use the switch to vertical layout and switch to horizontal layout options in the upper-right corner to change the position of the data and visualization.   Click Back to Report to return to the summary display. |
| Spotlight | Bring visual focus to the selected widget by dimming the other widgets. Click Spotlight again to return to the default view. |
| Sort Descending/Sort Ascending | Arrange the information in the widget in alphabetical order either descending (Z-A) or ascending (A-Z). |
| Sort By | Arrange the information in the widget using bases that are unique to each widget. The options in the Sort By sub-menu vary depending on the widget. |
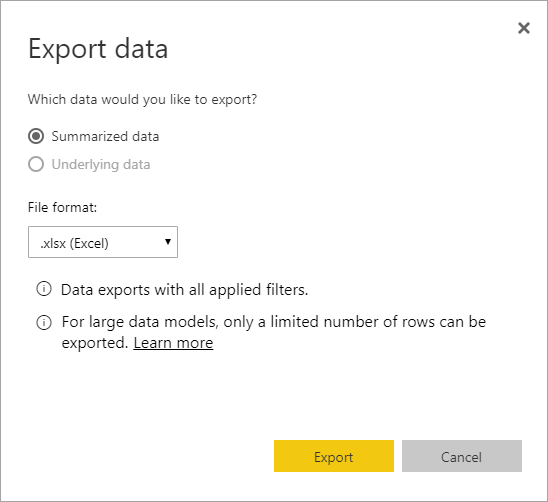
Data in the reports can be exported in a .xlsx (Excel) or .csv (Comma Separated Values) format. The option to export report data is in the More Options menu that in located in the upper-right corner of each report. The summarized data exports the information from the display view with all applied filters. The underlying data export is not enabled for any user. For large data models, only a limited number of rows can be exported. Learn more